Occupancy Monitoring on Campus: The Real Foundation for AI-Ready Parking Analytics
Campus parking leaders are hearing more about AI every month. Institutions want better forecasts, fewer complaints, and smarter use of space. It can be tempting to search for a tool that will “just predict it” for them.
In practice, the real foundation for any AI‑ready parking analytics is much simpler: reliable occupancy monitoring. Before AI can help, it needs trustworthy occupancy data that reflects actual space utilization across the campus.
Why Campus Parking Demand Is Hard To Predict
From the outside, campus parking demand looks predictable. It spikes at the start of term and around major games or performances. In reality, much of the pressure comes from everyday busy days and mid‑size events that never make it onto a central calendar. A single department event with a few dozen visitors can quietly overload a garage more than a well‑planned game, simply because no one anticipated where those parkers would land.
Holidays are usually the easy part. The real challenge is managing normal days when garages creep toward full, parkers are circling, and the parking team is dealing with complaints from every direction.
Gut feel helps, but it only goes so far. To make better, more informed decisions, operators need to see how full each lot and garage really is over time, how occupancy levels shift by day and season, and which occupancy patterns match class schedules, weather, and events. Occupancy monitoring provides that clear, consistent view of how parking assets are actually used. With that in place, analytics become useful and AI has something solid to build on.
What Occupancy Monitoring Means For A Campus
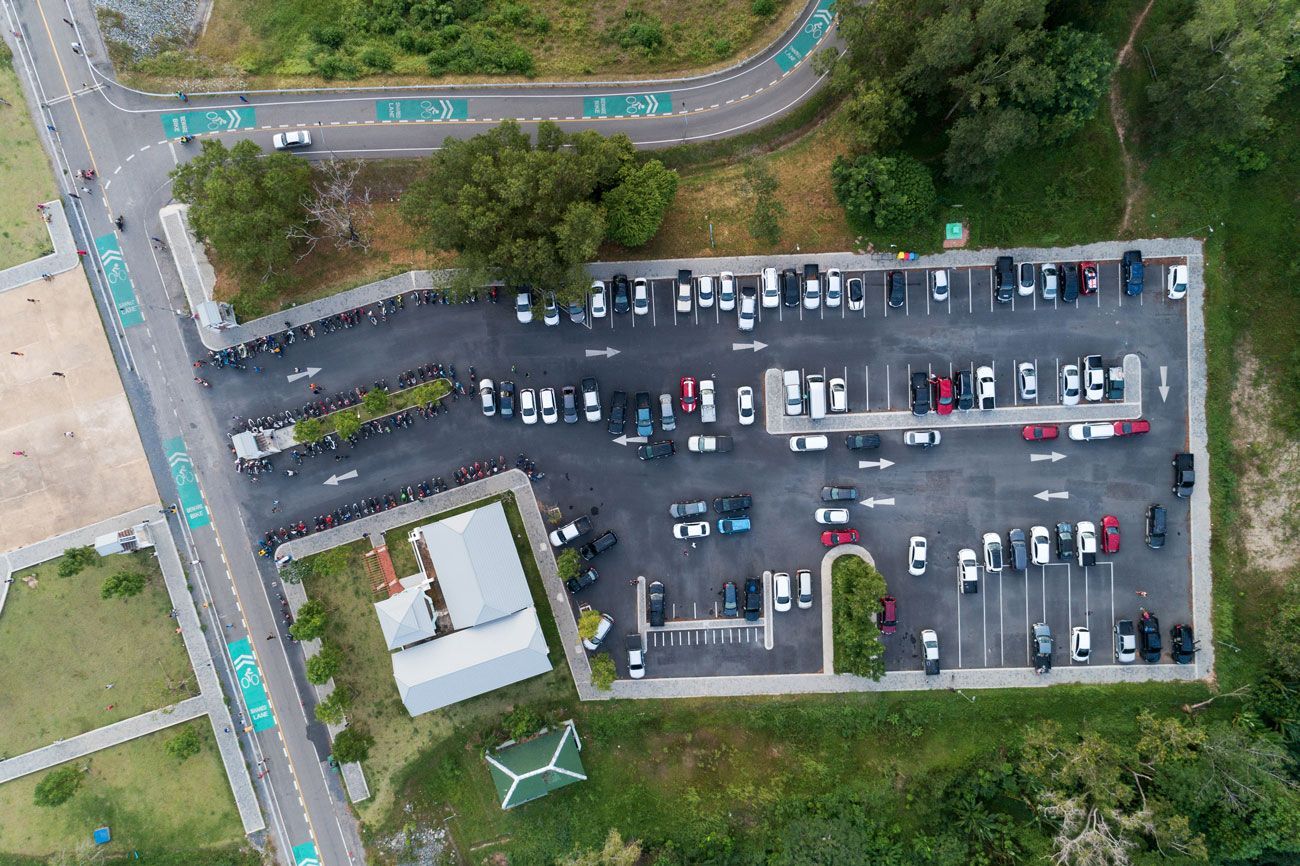
On a campus, occupancy monitoring answers a simple question: how full are the facilities, right now and over time?
The clearest answer comes from real time occupancy data. Cameras, in‑ground sensors, or fixed LPR can report whether a space is occupied as conditions change. This kind of continuous, intentional collection of occupancy is the gold standard, especially in high‑demand locations where a single occupancy sensor can make a big difference to real time decision‑making.
Many campuses also rely on point‑in‑time counts, where staff record how many spaces are taken at specific moments. When those counts are stitched together across a day, a week, or a semester, they reveal useful occupancy patterns even without continuous feeds.
On top of that, most campuses already collect proxy signals. Mobile payments, pay station use, and EV charging sessions do not measure occupancy directly, but they are strong hints about space usage and utilization at scale. Over time and with enough volume, those signals become a reliable proxy for true space occupancy.
In some facilities, it also makes sense to use calculated occupancy. A portion of a lot or garage is measured directly, then the rest is estimated based on that sample and appropriate weighting factors. This is not guesswork; it is a structured use of existing occupancy data.
Crucially, an effective occupancy monitoring system is not only about high‑demand areas. Empty or under‑used spaces in less‑desirable locations are just as important to measure. They reveal where people could, or may need to, park. When operators can see both the pressure points and the slack in the system, they can guide parkers to available parking and, if desired, adjust prices or policies to encourage use of those areas. That is how occupancy monitoring supports better space utilization and a smoother user experience for drivers.
Taken together, these inputs form an occupancy monitoring system that shows how the parking inventory is truly being used. The data does not have to be perfect. In most cases, campuses already have more than enough occupancy data – real time or otherwise – to support better analytics today and prepare for AI‑assisted forecasting tomorrow.
Turning Mixed Data Into Clear KPIs
The difficult part is not collecting occupancy data; it is making sense of it when it comes from so many different sources. Real time camera feeds, manual counts, payment data, EV sessions, permits, and access control all describe occupancy in slightly different ways.
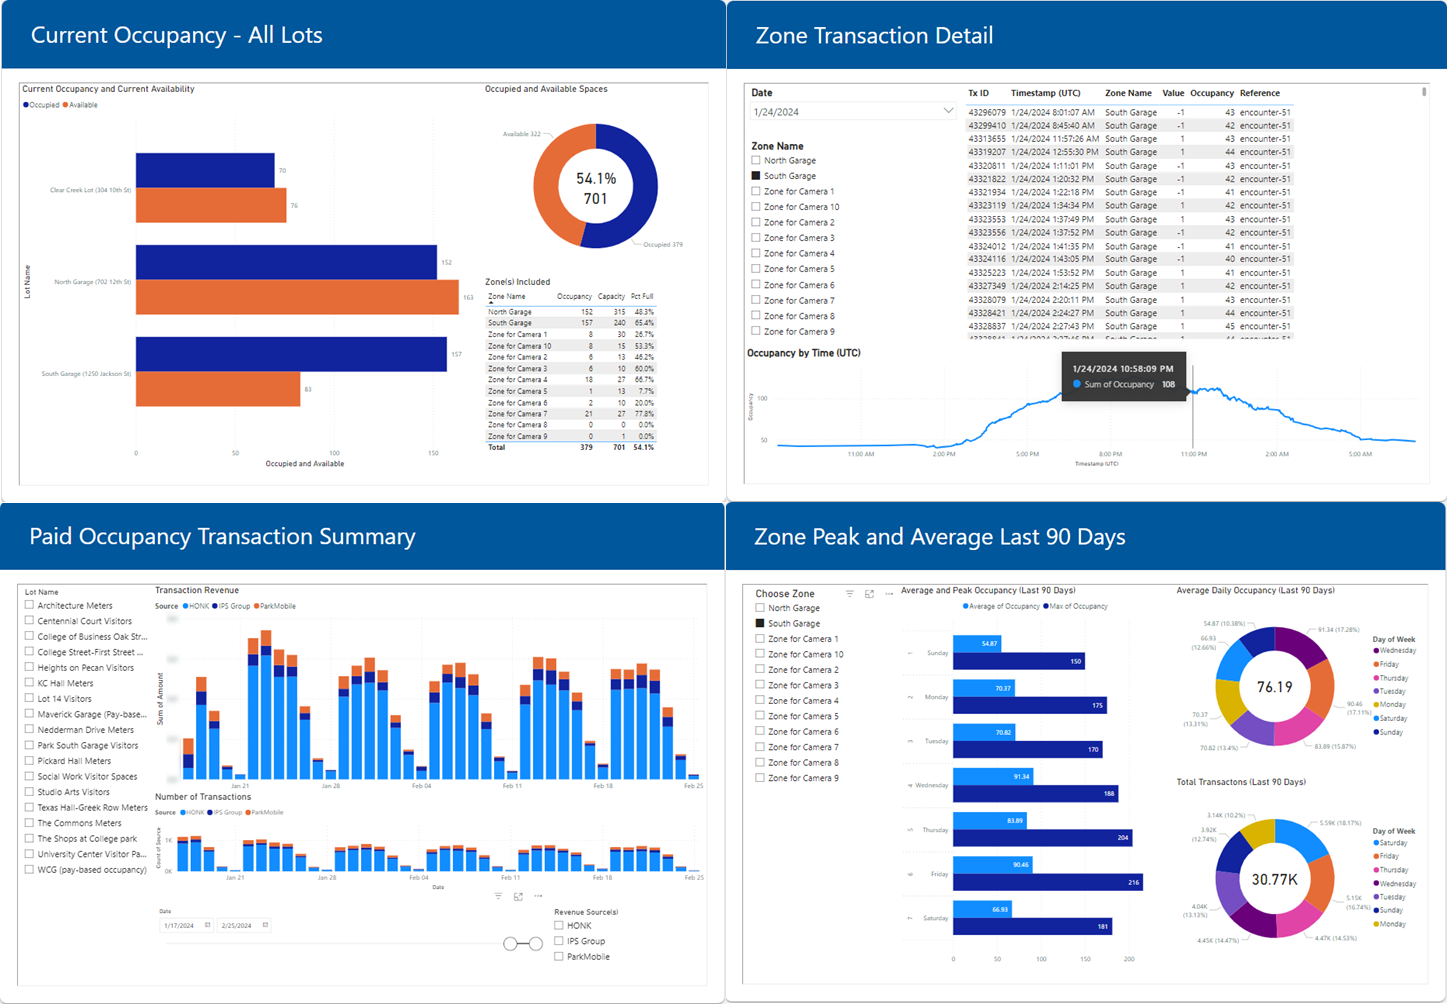
Mistall’s platform is designed to take these inputs and convert them into a standard view of occupancy monitoring. Data from continuous, point‑in‑time, proxy, and calculated sources is normalized into common occupancy metrics and KPIs. This allows parking leaders to compare garages, lots, and time periods without juggling conflicting reports or trying to remember how each source behaves.
Data health is a key part of this picture. Mistall not only measures occupancy; it also tracks how fresh each reading is, which sensor or data source it came from, and how continuous it is. Live, direct occupancy data is ideal for driver guidance and quick decisions. Older or more indirect signals still matter, but they are better suited for analysis, usage trends, and planning.
Once occupancy data is normalized and its health is visible, the insights become practical. Operators can see which garages quietly hit critical levels at the same time each week, where space utilization is too tight or too loose, and where minor operational changes would improve overall efficiency. They can also identify under‑used locations that could absorb more demand if drivers were guided or priced toward them. This foundation is what makes AI‑ready parking analytics possible. When the inputs are clean and consistent, advanced tools can add value instead of noise.
What AI Can Really Do With Occupancy Monitoring Today
Much of the conversation about AI in parking jumps straight to prediction. In reality, the most useful role for AI today is more grounded: helping parking teams understand the occupancy data they already have.
AI excels at pattern recognition. When an occupancy monitoring system feeds in data from cameras, sensors, payments, and access systems, an AI engine can scan it all and highlight relationships that would be hard to find manually. It can reveal how occupancy levels align with specific class schedules, which days and times reliably push demand over safe thresholds, and how weather or event types change behavior.
AI can also act as an assistant that runs routine analytics at scale. It can generate comparisons, spot anomalies, and summarize occupancy insights across the entire system without human analysts needing to pull every report by hand. The heavy lifting is automated; the human team provides the context and final judgment.
What AI cannot do, at least not responsibly, is run the operation on its own. AI cannot be held accountable for its results. Someone must still take responsibility for pricing, enforcement, and access decisions. If the underlying occupancy data is thin or inconsistent, AI’s output will be unreliable no matter how polished it appears. That is why solid occupancy monitoring comes first.
Getting Ready For Future Forecasting
For campuses that want AI‑ready parking analytics in the future, the work begins with the occupancy monitoring they control today.
A sensible first step is to inventory existing data. Most campuses already collect more occupancy data than they realize: payments, permits and access logs, camera feeds, sensor data, enforcement records, and manual counts. Mapping where each source lives, how often it updates, and which facilities it covers gives a clear view of the current monitoring system.
From there, it makes sense to strengthen real time occupancy monitoring where it has the most impact. That might mean activating existing cameras, adding a few additional occupancy sensors in high‑pressure locations, or tightening how feeds are captured and stored. Even small gains in live occupancy data at critical garages can have a disproportionate impact on both driver guidance and analytics.
The next step is to deepen and contextualize the data. Consistency over time matters more than perfection. Adding context such as permit type, zone, or event tags turns raw counts into occupancy data that is ready for serious analytics. When operators know not only how full a lot is, but who tends to use it and when, forecasting becomes realistic rather than theoretical.
Finally, it helps to layer in the external factors that shape demand: class schedules, the academic calendar, major events, and weather. These signals explain why occupancy patterns behave the way they do. When they sit alongside occupancy data, AI tools can find meaningful patterns and support smarter operations.
A Practical Place To Start
For campuses feeling pressure to “do more with AI,” it helps to remember that the most important work happens before any model is turned on. Solid occupancy monitoring is what turns day‑to‑day activity in lots and garages into occupancy data that can be trusted. From there, analytics get sharper, patterns are easier to see, and AI becomes a useful advisor instead of a black box.
Most campuses are already closer than they think. From a data perspective, many are richer than they realize. The real gap is pulling that data together, normalizing it, and making it easy to use.
Mistall’s role is to unify the occupancy data a campus already has, measure its health, and provide clear occupancy monitoring insights that can be acted on right away. Once that foundation is in place, AI‑ready parking analytics and smarter operations become a natural next step, rather than a leap of faith.