Visualizing Parking Success: Using Parking Dashboards to Build Trust & Credibility
How Vehicle Counters Turn Parking Opinions Into Parking Facts
Campus parking directors rarely lack experience. Most have spent years learning which lots fill early, which complaints are habitual, and which peaks are real versus perceived. That intuition has real value.
The problem is that intuition does not always hold up in a meeting room.
When a student, staff, or faculty member tells a VP that the south lot is always full, experience alone is not enough. The parking director needs objective, time-stamped evidence of what is actually happening across their parking operation. That is what an occupancy solution provides.
Credibility Is the Real Metric
The challenge most campus parking managers face is not a lack of information. It is a lack of credibility.
When parking data is fragmented — manual spot checks here, a spreadsheet there, anecdotal complaints elsewhere — one frustrated faculty member with a vivid story can carry more weight in a leadership conversation than years of accumulated parking experience.
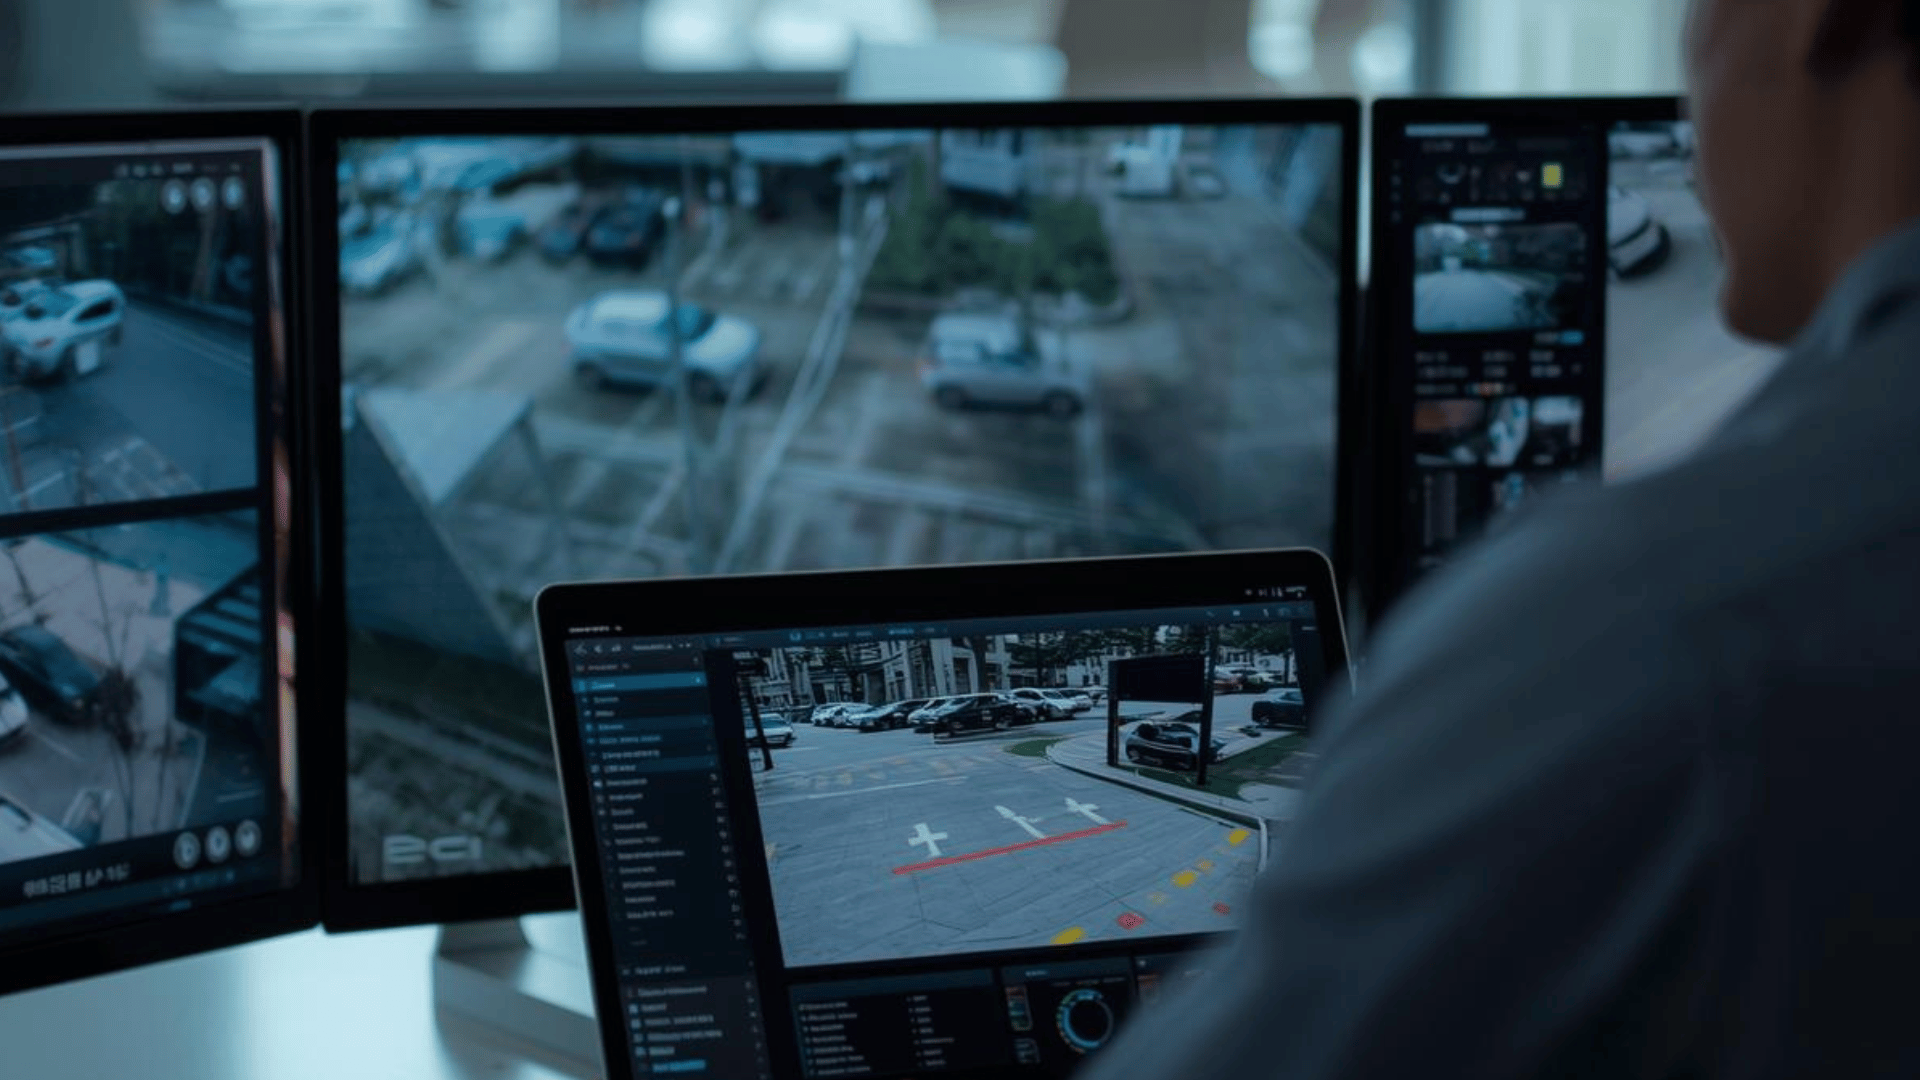
An occupancy solution changes that dynamic. It produces objective vehicle counts entering and exiting a facility, down to the minute, every day. When a director can show exactly how full a parking lot was, at exactly what time, for exactly how long, the conversation shifts from opinion to evidence. That is how parking managers move from reactive to data-driven decisions.
How Full Is Full?
The phrase "the lot is always full" gets used constantly in campus parking management. It rarely means what it implies.
Full at 8:45 a.m. for twenty minutes is a very different operational reality than full all day. Without a vehicle counter capturing that pattern, the director has no way to make that case. As the saying goes, you do not build the church for Easter Sunday.
Objective utilization data lets directors show when peak occupancy occurs, how long it lasts, and what the parking lot looks like the rest of the day. That clarity stops reactive decisions before they start and surfaces inefficiencies that would otherwise go unnoticed.
The Metrics That Belong on a Campus Parking Dashboard
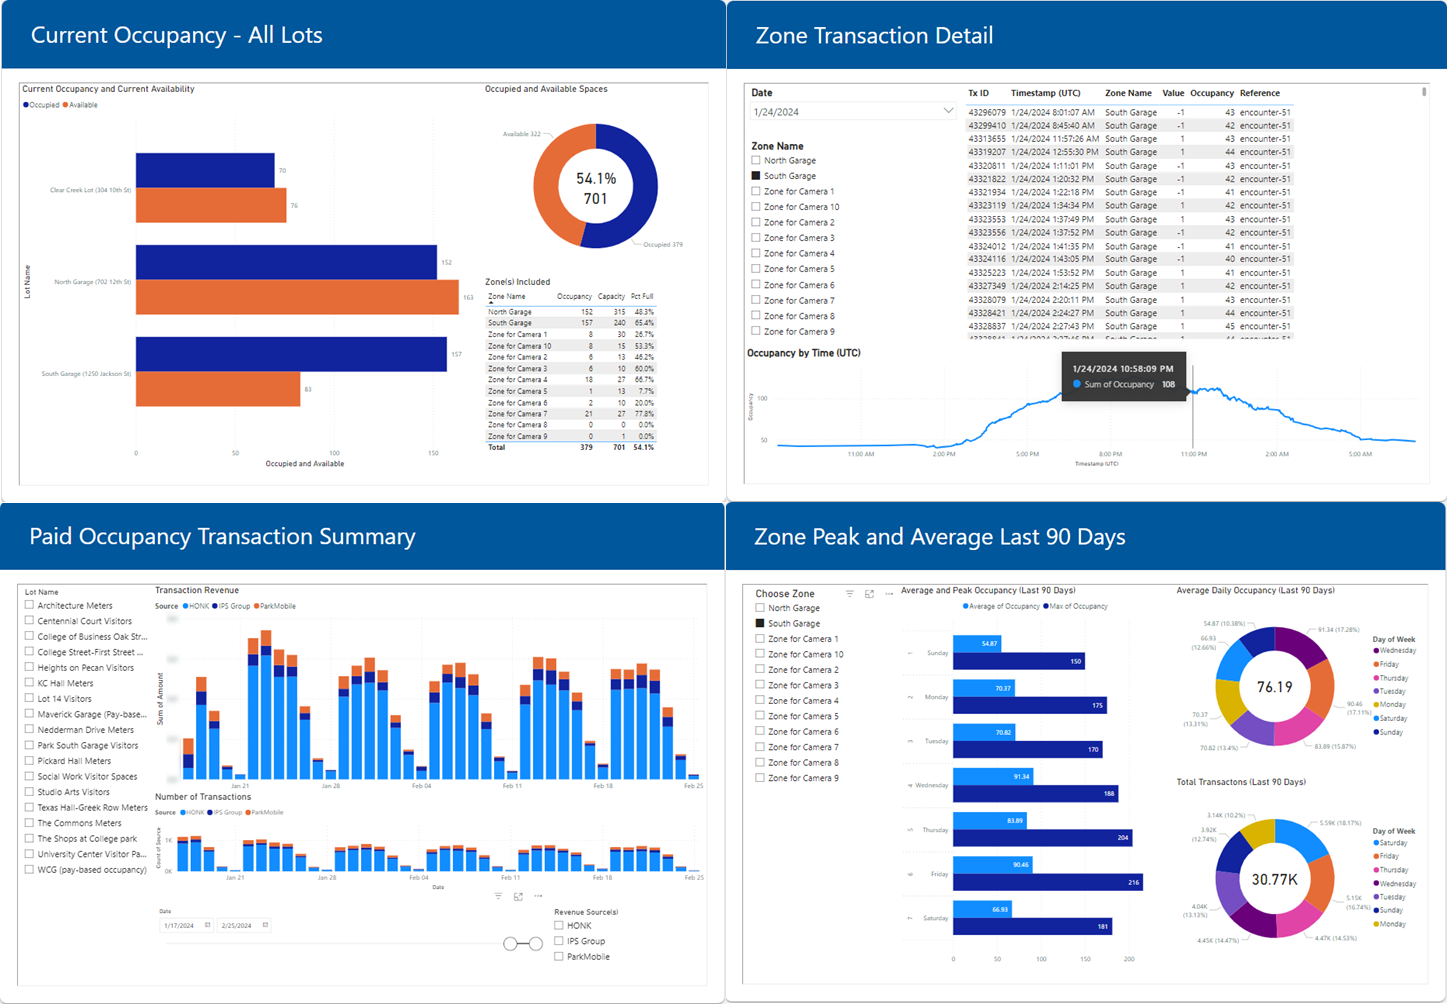
Peak and average occupancy is the starting point. Peak shows when a parking facility reaches its ceiling. Average shows what normal actually looks like. Tracking both across all lots simultaneously matters too — two facilities might be regularly maxed out while eight others have available parking spaces, a pattern a campus-wide average would hide entirely.
Utilization over the course of the day reveals behavior that peak numbers miss. Does a lot empty at noon and refill an hour later? Understanding that rhythm helps parking management teams allocate resources and set realistic expectations.
Arrival and departure rates are increasingly important from a traffic management perspective, particularly during events. When large numbers of vehicles enter or exit at the same time, traffic flow is disrupted beyond the parking lot into shuttle schedules and pedestrian crossings. Tracking ingress and egress through vehicle counters and traffic counters helps directors anticipate those pressure points before they generate complaints.
What Live Counts Do for Drivers
Real-time traffic data is not only useful for internal reporting. When availability is known, it can be shared — on a campus website, a mobile app, or digital signage. Drivers who know where space is available go there directly instead of circling through lots.
The goal is not to tell people where to park. It is to give them enough information to make their own best decision. That shift reduces circling, lowers frustration, and produces fewer complaints.
Visuals That Non-Technical Administrators Understand
Presenting parking performance to a dean or campus stakeholder does not require complex charts. It requires the right visual for the right audience.
Color coding is one of the most effective tools available for parking dashboards. Red, yellow, and green map immediately onto what people already understand — no number required. A bar chart showing occupancy by hour tells a clearer story than a column of percentages. The goal in each case is the same: make the insight visible in seconds.
Beyond the Spreadsheet
Most parking systems can export traffic data to a CSV or Excel file. That is a reasonable starting point, but it has real limits. Excel cannot bring data from multiple systems together, normalize it, or surface the insights that only become visible when everything is in one place.
When vehicle counter data, citations, parking permit records, LPR, PARCS, or parking payments are unified, it becomes possible to see things no single system would reveal on its own. Mistall aggregates and normalizes utilization data from existing sources — doing the heavy lifting so directors can work from a single, coherent picture rather than jumping between disconnected reports.
Tools That Grow With the Campus
Campuses may end up with a mix of vehicle counting technologies. Cameras work well in some environments, sensors in others. What matters is whether data from all of those sources flows into one place.
Campuses also change. New lots get added, GIS platforms get adopted, and data sources evolve. Mistall is built to be technology-neutral, working with the vehicle counters and parking solutions a campus already has and adapting as needs shift.
Start With the Data You Already Have
Most campuses are already collecting more parking data than they realize. The first step is understanding what exists and what it could look like in a unified view.
A walkthrough with Mistall is a practical place to begin. Bring whatever data you have today — vehicle counter feeds, LPR, payments, citations, permits, manual counts — and see what becomes possible when it is all in one place. Reach out through our contact information below to get started.